The Population Analysis
The population of St. John's alone consists of 106, 172 people, which is around 0.3% of Canada's population. Within the following lesson, you will thouroughly learn about St. John's demography.
The population of St. John's alone consists of 106, 172 people, which is around 0.3% of Canada's population. Within the following lesson, you will thouroughly learn about St. John's demography.
|
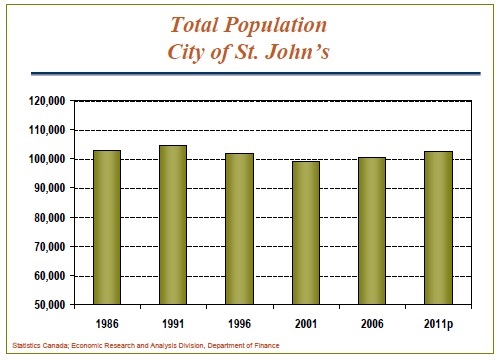
With the illustrated graph above (Statcan, 2015), a constant pattern of St, John's population around 100, 000 people can be observed (Statcan, 2015). However, one may also come to realize the logistic pattern of St. John's annual population. With the increments of 5 years, the population increases from 1986 and 1991. However, the population decreases until 2001 when the population shows another increase towards 2011 (Statcan, 2015). Through extrapolation with the data of; patterns and knowledge gained from this graph, we can assume the very likelihood for the population of St. John's to decrease and continue to follow this unique logistic pattern.
The age/gender make-up of St. John's
|
|
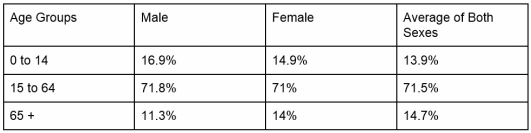
Here, we have a
Data Table to represent the gender consisted in St. John's by the divided age
groups. One may easily
realize the very drastic difference in population amongst the age groups
of 15-64 and 65+. From this, not only can we assume a high death rate
amongst elders, but we can also assume a large population
boost during the years, 1942 and 1991 (Statcan, 2015). The population boost is likely
to have been caused by the discovery of the oil wells in the Grand Banks during
the 1940s which attracted many people around the world for plentiful job
opportunities and substantial settlement. With such a sudden increase in
population, not only should one expect a population boost, but an increase
in annual total births and deaths should be expected as well (Statcan, 2015). Also, with
71.5% of the citizens consisted by adults (15 to 64), the number of active
workers to support the city is plentiful. Thus, the community has an active
source of citizens to supply rich services within the community (Statcan, 2015). With the dependency
load of 40%, St. John's has a lower dependency load than the city of
Toronto by 3.12%. This proves that the working citizens between the ages of
15-64 has less people who depends on them. With this fact, one may see St.
John's as a very "self-sufficient" city.
Future Predictions
Due to the logistic pattern shown in the population graph, we can safely assume a natural decrease in St. John's population for the next 5 years prior to the year 2011 until 2016. However, it is an undeniable fact that a sudden, unexpected factor may disrupt this natural pattern in the future. Realistically, accurately predicting when and what this factor may cause is an impossible task. Thus, geographers make evidential assumptions with their obtained knowledge and patterns from the past. Events such as the collapse of the fishing industries in the 1990s and the Three Great Fires of Newfoundland are predictable factors that may once again cause unexpected decrease in the populations of the future.
However, we can also predict pull factors that draws people into the country. For example a discovery of another oil bank will open up job opportunities resulting in a sudden increase in population due to people seeking jobs.
Also, the very small population of elders in St. John's defines a high death rate amongst citizens with the ages of 65+. With Canada's rate of technical advancements, further aid towards the city of St. John's is predictable. This may come in forms of hospitals, elderly homes, and offers for a more beneficial life insurance for the elderlies. With a more reliable environment for elderlies are provided, retiring adults may decide to move into the community with the relief of knowing the available care.
